Click above to see an encapsulation info-video on equity investing with The Total Beverage Companies.
DISTRIBUTION based companies are some of the most sought after in the investment, venture capital and private equity group communities. The following are reasons for the popularity of Distribution as an investment vehicle. Total Beverage and its Production Brewery model is entering the distribution industry with its freshly brewed beer and hard seltzer products.
The following are portions of an article written by Alan Beaulieu, NAW Senior Economic Advisor, and President of ITR Economics. Data in this article is accurate as of March 31, 2020.
The distribution industry is a major contributing factor to the United States Gross Domestic Product (GDP). U.S. Nominal GDP: $21.44 trillion - U.S. GDP (PPP): $21.44 trillion. The U.S. has retained its position of being the world’s largest economy since 1871. The size of the U.S. economy was at $20.58 trillion in 2018 in nominal terms and is expected to reach $22.32 trillion in 2020.
The Wholesale Distribution industry experienced a lackluster 2019 as far as revenue is concerned, with growth for the year coming in at a slim 0.6% above 2018. The latter half of 2019 contained the most disappointment with a steeper-than-normal third-quarter decline in the three-month-moving total and a fourth-quarter rise that was barely within the parameters of normal. Total Wholesale Distribution revenue ended the year at $5.970 trillion, just slightly below the April 2019 record high. GDP for the year totaled a record high $21.734 trillion with a growth rate of 4.0%. The Wholesale Distribution industry is 27.5% of U.S. GDP.
The NAW 2020 Executive Summit in Washington reminded attendees to “Innovate to Dominate.” It would seem many distributors are in tune with that theme, as the industry posted significant profits in 2019. Presumably, distributors embraced productivity improvements that more than offset increased labor costs, resulting in healthy profit gains even as revenues produced a slim increase over 2018. U.S. Corporate Profits for Domestic Wholesale Trade Industries came in a stellar 17.5% above the same time last year (12MMA basis – 12 months moving average). Profits rose to $120.1 billion for the 12 months ending in September 2019 (latest-available data) but the 12MMA rate of rise was the mildest since the early 1990s. In addition, further slowing in the growth rate is anticipated into at least early 2020. Profits in the industry outperformed the manufacturing industry through the same time period (September 2019). Manufacturers saw third-quarter profits come in 8.1% below the year- earlier level with further cyclical decline indicated. The manufacturers profit 12MMA has been in a generally declining trend since a March 2015 record high.
Wholesaler-distributors of durable goods reigned in inventory growth in the last quarter of 2019. The increase was a thin 0.74% from the annual average in September 2019 to the annual average in December, substantially milder than normal. Nondurable inventories moved higher in the fourth quarter at a normal pace. Wholesaler-distributors of nondurable goods should be careful given the economic difficulties projected through June. Supply chain issues are an issue in many industries. Alternate sourcing and customer conversations will be key when customer demand increases later in 2020 or in early 2021, depending on which market segments distributors serve.
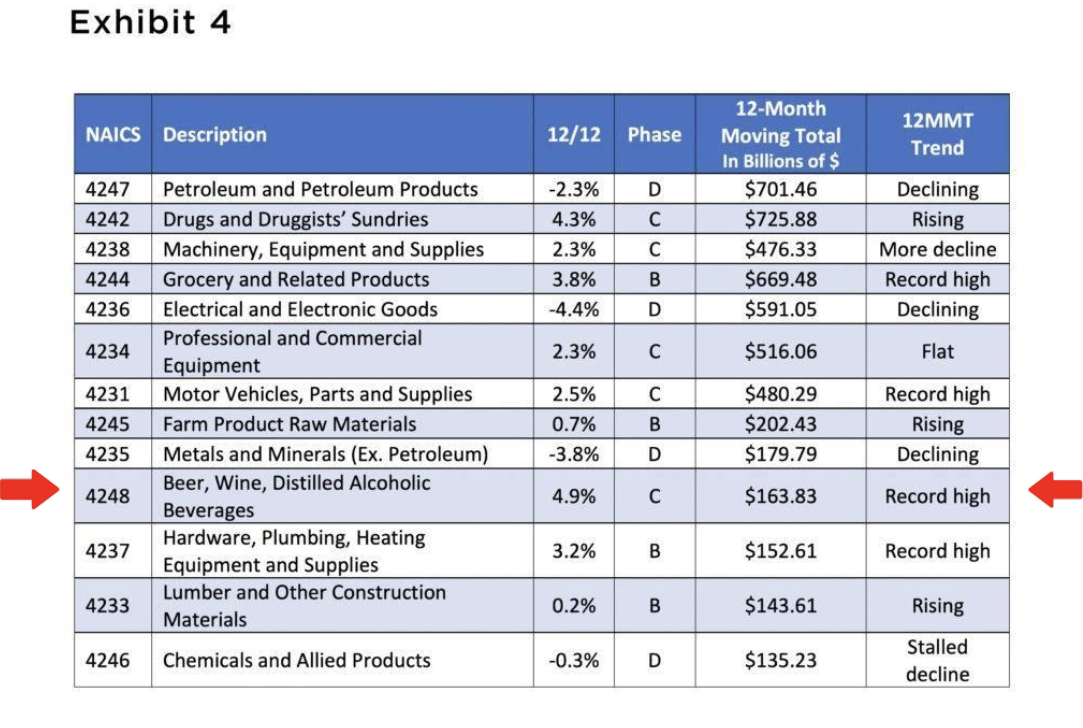
Exhibit 4 provides a more detailed look at the industry-by-industry segments. Please note that sales growth at the company level will be harder to achieve.
Retail Sales are one of the keys to general economic expansion in the U.S. and, therefore, key to the Wholesale Distribution industry. There is a positive signal emanating from Retail Sales in that the rates-of-change are moving higher.
To summarize, Total Beverage’s entrance into the distribution industry with its freshly brewed beer and hard seltzer products eliminates the wholesaler/distributor and the associated price markup, which makes this investment more attractive with an increased return on investment or ROI. TOTAL BEVERAGES COMMENTS APPEAR IN BOLD EXCLUDING TITLES AND HEADINGS.
Total Beverage offers to build out with our team of experts, specialists, professionals, and professional solution companies third party brewpubs for any potential customer in any of the 50 states. Total Beverage also offers equity shareholder partnership opportunities on any of our production brewery manufacturing distribution projects. Our equity ownership opportunities for our production brewery distribution projects start at $100,000 and are projected to earn more than most investment partnership opportunities. On a soup to nuts menu of options, each location is different and has differentials and variables on pricing and our pricing we give as estimated startup costs and projected monthly operational expenses are somewhat standard and can flex from state to state and county to county. Start-up costs for a production brewery distribution location are approximately $2,250,000. (+/-) for a 15 BBL brewhouse system with 30 BBL (double batch) fermentation and brite tanks and potential operational expenses are approximately $125,000.00 a month. Size of brewery equipment will change the estimated start up and total costs. The return on a larger system has a larger return on investment (ROI) than smaller BBL systems.
When we opened our brewery, bar and restaurant property in Lake Mary, Florida in 2019, we did not start to brew for the first few months as there were a lot of moving parts in a brewery, bar, restaurant with a full kitchen. We purchased beer from our partner 10 miles away and that gave us an advantage over those who brew and consume. We got to understand what beers sold better than others, without over brewing and over stocking certain beers as well as understanding our true consumption rate of beer in an actual location, which makes that data and information vital, crucial, and invaluable when using for projections in this our new production brewery business model. With that being said in our new model of a production brewery, which provides beer to other brewpubs (guest taps), bars, restaurants, lounges, clubs, bistros, taverns and convenience and package goods stores and gas stations, or wherever beer is sold legally, we can use our average actual consumption in our Lake Mary, Florida location to accurately project the needed amount of consumption for each potential seating customer location in order for us to attain our revenue projections or barrel production, which translates into revenue. By using “back into” formulas we can figure out how many fermentation tanks are needed and how many brews per day are needed to attain these projected revenue and barrel production levels. This allows us to purchase the right equipment with the right number of tanks to achieve the desired revenue / barrel projections.
Average consumption per potential customer location is estimated at 6 kegs a week (1 keg = 1,984 oz or 165.33 12 oz glasses), 25 kegs a month (49,600 oz or 4,133.33 12 oz glasses) 300 kegs a year per location @ $175 per keg = $52,500 a year per average client.
In order to get accurate representations, in the process of doing our sales, marketing and promotion due diligence to set up the proper strategies, policies and market segmentation, we sent out three balanced teams of two salespeople into three different markets (1.) Orlando Florida, 2.) Dallas Texas, and 3.) Denver Colorado. Each sales team consisted of a male BrewMaster and a professional beer expert saleswoman. They spent a week in each market and brought in several different fresh beers for tasting to owners and managers of brewpubs, bars, restaurants, lounges, and clubs. In all three markets with a reduced keg price of $175 per keg (when the big manufacturer distributors keg potentially sell for $195 each plus a keg deposit of $35 on the average depending on the market) we offered no keg deposit and over 75% of the time were able to capture at least 1 guest tap as an average in all three states. When we offered a free keg per tap for three guest taps, our close ratio increased to over 90%. In many states, including Florida, giving away free beer is illegal, so instead we offer to donate to each potential client’s locations charitable and benevolent causes. This made it legal and changed the modeling. The usual modeling is manufacturer, wholesaler (distributor) and retailer (end seller), in this case thinking out of the box, we become the manufacturer using a separate friendly company as a private distributor and they, the distributor sell direct to the retailer, thus eliminating a middleman and a larger product mark up. Florida, like many other states, also has the three-tier law, manufacturer, distributor, and end seller, and suggests that you can only be one of the three and requires no common ownership between any of the three tiers. Local brews are supported by local industry businesses and businessmen and with this type of aggressive direct sales, there is enough business out there to build up a production brewery facility and to attain our projected annual revenue and barrel (BBL) production levels.

This is where the “back in formulas” comes into play. Assuming our barrel projection is 13,333 barrels per year, which is 26,667 kegs per year. We would close for a two (2) week maintenance period for the equipment, so we would brew for 50 weeks. Using the average brewing fermentation period of two weeks or fourteen (14 days) there will be 25 fermentation periods of 2 weeks each.
1st formula to determine number of batches of brewing needed per day: 13,333 barrels divided by 20 BBL (brewhouse tank capacity) = 666.65 batches divided by 50 weeks = 13.33 batches per week divided by 7 days a week of brewing = 1.90 batches per day or 6 days a week of brewing = 2.22 batches per day.
2nd formula to determine amount of fermentation tanks needed to achieve barrel / revenue projections: 13,333 barrels divided by 25 fermentation periods of two (2) weeks each = 533.32 divided by 40 BBL (fermentation tank capacity) = 13.33 fermentation tanks needed.
For most brewpubs that service the consumer directly, like our Lake Mary, Florida property, the ratio of one to one, fermentation tanks to brite tanks is acceptable. For a production brewery the acceptable ratio of fermentation tanks to brite tanks is three (3) or four (4) to one. So, the suggested ratio for this 20 BBL brewery system with 40 BBL fermentation /brite tanks is 13 fermentation tanks to 3 brite tanks, which is a 4.33 to 1 ratio.
Total Beverage is entering the hard seltzer market, which has less ingredient costs and 30% higher return per can than beer. This will diversify and expand our product lists as well as our clientele and bring in additional consumers to our customer base. The fermentation time for hard seltzer is 30% less than most beers. Total Beverage has not calculated any hard seltzer costs or projected revenue for this additional product in the five-year business plan or any revenue calculations, but it will dramatically increase our return of investment (ROI). We will look to distribute our beers and hard seltzer products to brewpubs (guest taps), bars, restaurants, lounges, clubs, bistros, taverns and convenience and package goods stores and gas stations.